
Workforce Analytics Software
WebWork turns tracked hours into productivity scores, activity levels, and app usage reports for every member, project, and team. Managers see who worked on what, how focused that time was, and where hours ran past budget. Pricing starts at $3.99 per user per month.
No credit card | Cancel anytime
Workforce Analytics Reports and Dashboards
Get workforce reporting and analytics based on the tracked hours of your team. WebWork lets you select from a workspace-wide view down to one person's minute-by-minute log without exporting anything or joining two tools together.
Real-time monitoring
See who is working right now, which app or website is open, which project and task is in progress, and which tracker they are using. The same view shows who is absent or on leave, and columns are customisable and filterable.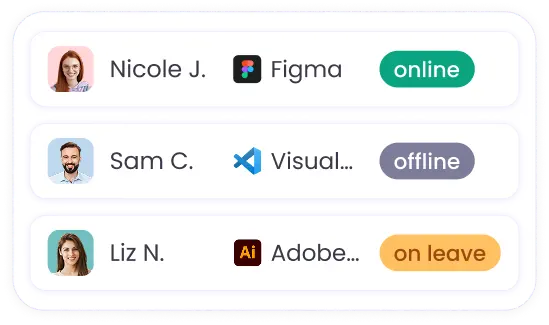
Productivity scores and activity levels
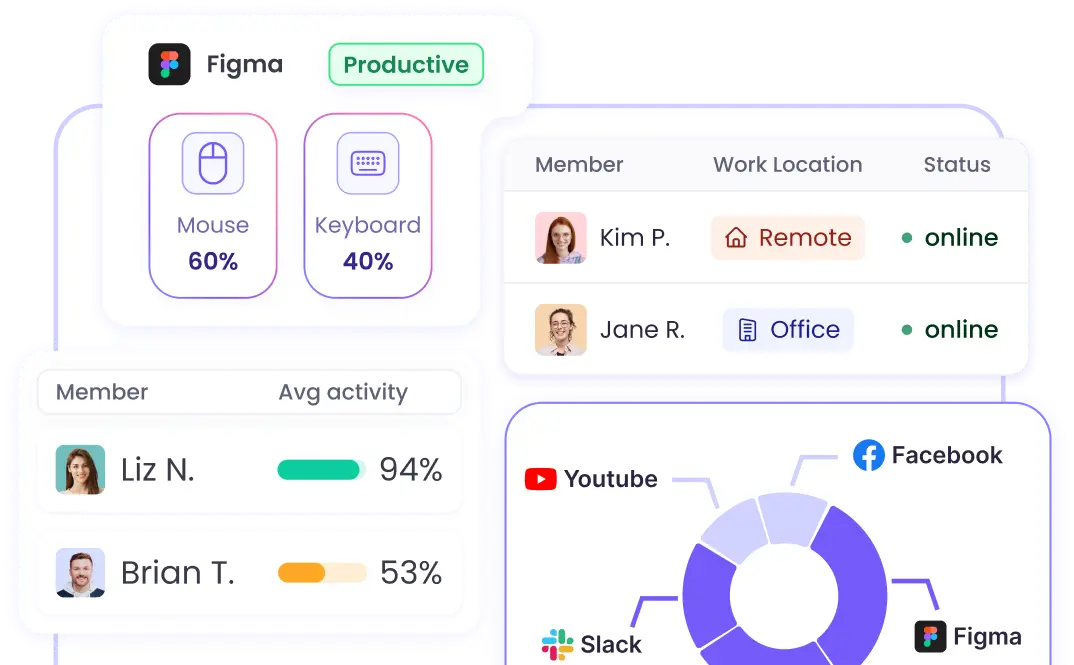
Every member gets a productivity score built from how their apps and websites are categorised, and an activity level measured from mouse clicks, scrolls, and keystrokes.Focus time and work mode breakdown
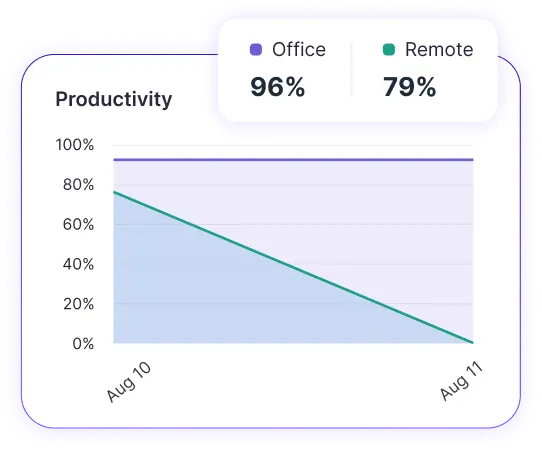
The Productivity Insights report splits the working day into Focus Time, meaning high activity with no distractions, and Shallow Time, meaning lower-activity work. It also breaks the day into active, inactive, idle, manual, break, leave, and holiday hours, and compares office performance against remote performance.App and website usage
See time spent per tool, with WebWork AI classifying each app and website as Productive, Neutral, or Non-Productive by role. Figma counts as productive for a designer and neutral for a support agent, and managers can override any classification per team or workspace.Daily activity log
A per-minute record of one employee's day: project, task, activity description, apps and websites, device, activity level, screenshots, and visited URLs.Hours tracked and labour cost
Read hours by day, week, or month, then switch the same report to amount view to see those hours as cost. WebWork separates overtime from regular hours automatically, and the timeline report shows tracked time by platform.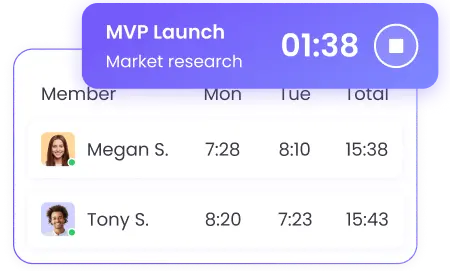
Charts, filters, and scheduled delivery
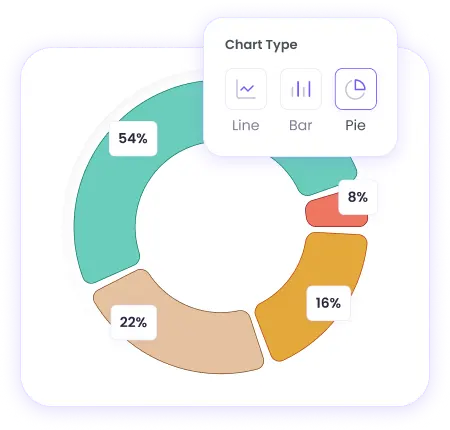
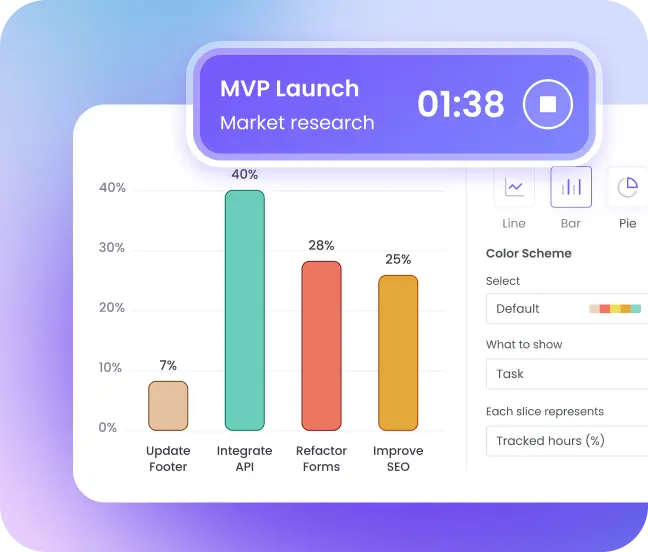
Any report is available as a pie, bar, or line chart, or as a calendar heatmap. Schedule reports to arrive by email, share one by link with someone who has no login, or export to CSV and XLSX. You can also create custom fields such as department, location, seniority, and more and use them as report filters.Where the Analytics Data Comes From
Every report above is built from what the tracker records while people work, so you don't have to import or enter data manually.
Time tracking on every platform
Members track from the desktop app on Windows, macOS, and Linux, the mobile app on iOS and Android, the browser, or the Chrome extension. The desktop app keeps recording when the internet drops and syncs once the connection returns.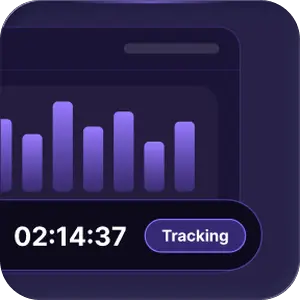
Screenshots and activity capture
Screenshots run at a frequency you set, silently or with a popup, alongside activity level and app and website usage. Each team can be configured separately, so a design team and a support team do not have to be monitored the same way.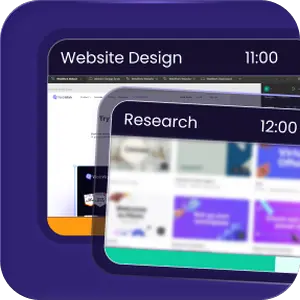
Attendance, shifts, and leave
Create shifts with their own start and end times, working days, and time zone. Plus, manage leave requests in the same system. Based on the set shift, WebWork measures attendance and gives you a detailed report, including reasons for being late or leaving early.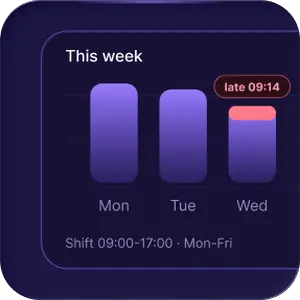
Projects, tasks, and billable rates
As a member tracks time, WebWork records it over the selected project and task. You can also set billable rates per member, project, or contract so the tracker can calculate earnings based on hours.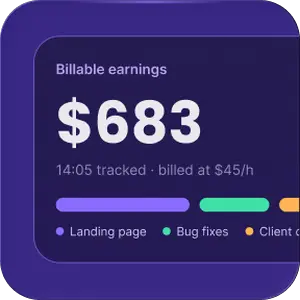
AI Workforce Intelligence
WebWork AI reads the tracked data and reports back in plain language, so you get an answer without building a report first.
It analyzes employee performance, flags overwork and irregular activity, writes daily activity summaries and emails them, classifies every app and website as productive, neutral, or non-productive by role and so much more. analyses break behaviour against your break policies.
For teams that want performance flagged rather than reviewed by hand, the Smart Monitoring add-on sorts each member into Positive, Neutral, Attention Needed, Negative, or Irregular Activity Risk.
Explore WebWork AI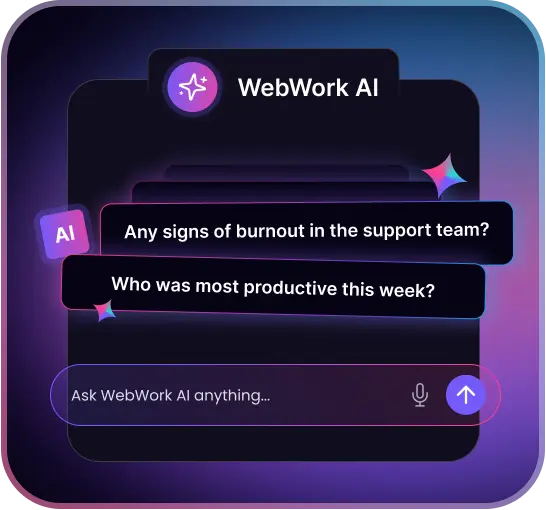
Workforce Analytics for Remote and Hybrid Teams
WebWork records the same data whether someone is in an office, at home, or on a client site, so remote and in-office performance appear in one report instead of two systems that disagree.
Compare remote and office performance directly
The Productivity Insights report includes an office-versus-remote comparison built from the same productivity scores and activity levels, so a hybrid policy decision rests on both groups measured the same way.
Keep tracking when the connection drops
The desktop app records time, apps, websites, activity levels, and screenshots offline, stores them locally, and syncs when the connection returns. Nobody has to re-enter a morning of work.
Track across time zones
Shifts carry their own time zone, start and end times, and working days. Attendance reports flag late starts, early finishes, and absences against each member's own schedule rather than a single head-office clock.
Track overwork and burnout risk
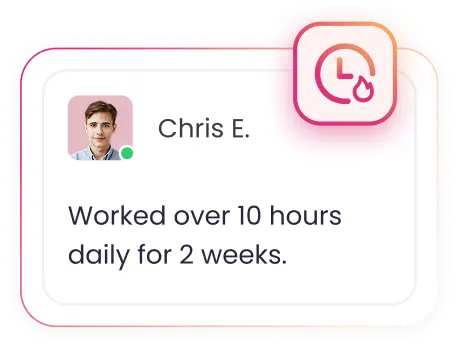
Burnout risk flags and work-life balance reports show who is consistently working past the healthy hours range you set.
Turn Your Tracked Hours Into Reports
Install the tracker, invite your team, and start measuring workforce productivity with analytics built from recorded work rather than estimates.
No credit cardCancel anytime
Workforce Analytics by Industry
The same workforce analytics platform serves teams that measure very different things, because every report filters by project, department, location, and contract.
Web and Software Development
Development teams read hours per task and per sprint against the estimates they set, using custom fields such as Sprint, Priority, and Complexity as report filters. App usage shows how much of a day went to the editor and how much went to meetings and review.
Marketing
Marketing teams track hours per campaign and per client, then read the amount view to see what each campaign cost to run. Billable and non-billable splits show where retainer time is going before the month closes.
Retail and E-Commerce
Retail teams match staffing to trading hours and see how much of a shift went to fulfillment against customer service. Shift compliance reports show who covered which hours and where overtime built up.
BPO and Outsourcing
BPO providers report agent activity levels and productivity scores per client contract, and invoice from the same tracked hours. Screenshots and daily activity logs supply the evidence clients ask for at review.
Call Centres and Support
Support teams read punctuality rankings and shift compliance against published schedules. App and website reports show how much of a shift went to the helpdesk and how much went elsewhere.
Transportation and Logistics
Logistics operations use GPS tracking to confirm drivers were where the route said, with map views of the journey between destinations. Shift and overtime reports cover the hours side.
Construction and Architecture
Construction firms use workforce analytics for productivity management on site, checking labour hours against project budgets and confirming attendance with GPS. Overtime reports show which crews are running past their shifts.
Healthcare and Care Services
Care providers confirm on-site attendance with GPS, track hours by location, and keep attendance records that hold up in an audit. HIPAA compliance is available on the Premium plan.
Integrations for Workforce Reporting and Analytics
WebWork connects to the tools your team already works in, so tracked time goes to the task, invoice, or payroll run directly.
For project data, connect Jira, Asana, ClickUp, Trello, Notion, Wrike, Teamwork, Todoist, or Azure DevOps, and the time tracked against a task appears on the matching task. For payroll and payments, connect Deel, Gusto, PayPal, Wise, Payoneer, or Stripe. For accounting, connect Xero or Zoho. Slack covers communication and Google Workspace covers access.
Go to All Integrations
Workforce Analytics on Every Platform
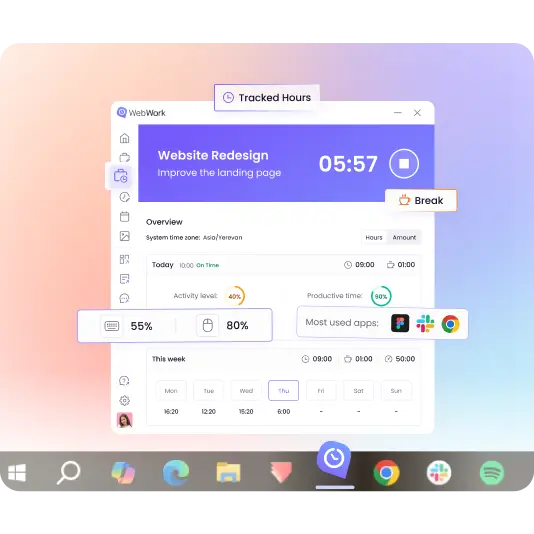
The desktop app runs on Windows, macOS, and Linux and records time, apps and websites, activity levels, and screenshots, including offline. The mobile app for iOS and Android adds GPS for field teams. The web tracker and Chrome extension handle time tracking only.
Access Control, Audit Trails, and Compliance
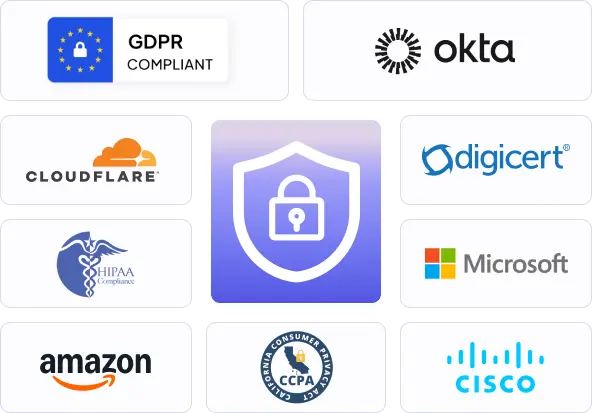
For maximum flexible control over workspace data security, WebWork lets you assign member roles with distinct permission and access levels. You get to control who sees which workforce analytics data, from Workspace Owner down to a member who only sees their own records. Executive manager permissions can be restricted by the owner. WebWork is GDPR and CCPA compliant, with HIPAA compliance, SSO, and SCIM provisioning available on Premium.
 About Security and Privacy
FAQ
Begin Tracking Time with a Workforce Analytics Software
No credit cardCancel anytime