Employee Time Reporting
WebWork Time Tracker offers detailed employee time reporting. It provides accurate data about your team’s tracked hours, productivity level, application and site usage, and much more. It can help you analyze data with easy-to-read charts, graphs, and tables.
No credit card | Cancel anytime
Accurate Reporting
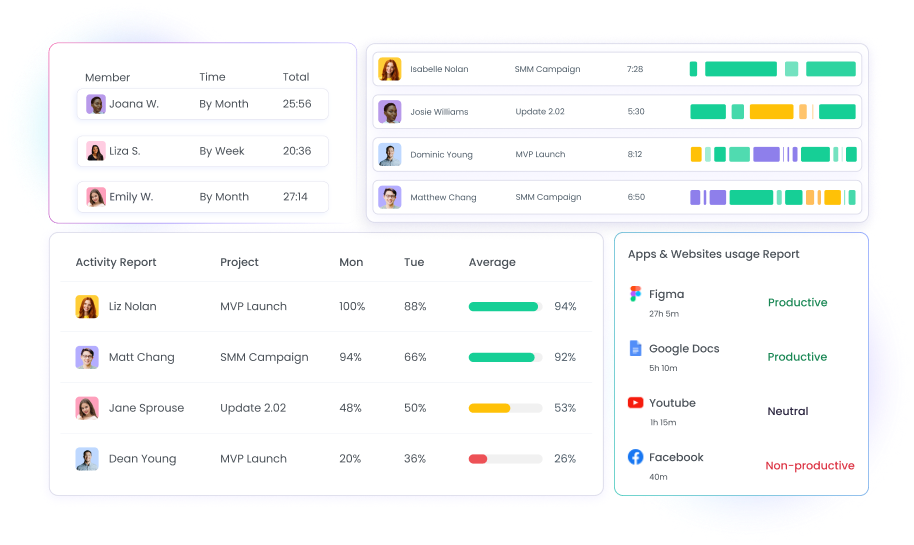
Using accurate data, WebWork helps you analyze your team’s performance with real-time reports.
Analyze employee performance
Visualize your company’s progress
Identify key areas of improvement
Report Types
Real-Time Monitoring
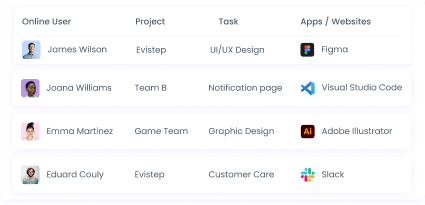
Monitor your company’s performance with real-time reports. View key details like how many workspace members are working, on leave, or absent. Sort team members by their productivity, activity description, and more. You can also see real-time reports for individual projects, teams, and members within the workspace. The time reporting software allows showing or hiding all data columns to help you customize your real-time reports. This will allow you to focus on what matters the most for your team.
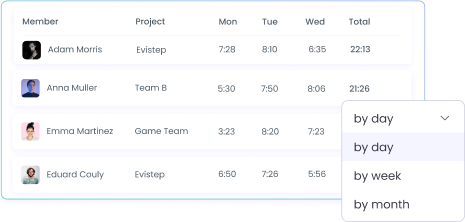
Hours Tracked
See how many hours members spend working at your company. Monitor tracked hours by day, week, or month and view the total working time of each workspace member. Analyze the total amount of hours your employees spent working over a period. To see an accurate report of earned amounts by each workspace member, switch to the amount view.
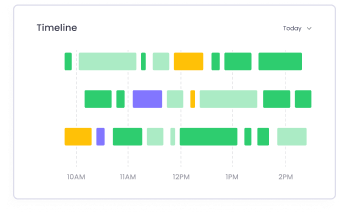
Timeline
See your organization’s tracked time in a timeline. Distinguish between time tracked on different platforms with online time reporting. You’re able to see when workspace members added time manually and tracked idle time over a period.
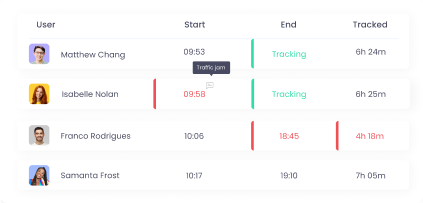
Attendance
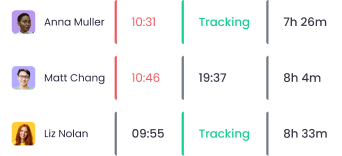
Track the punctuality of your members with attendance reports. The time reporting software will document when trackers are switched on and off. This will allow you to see who started working late, left early, or didn’t track enough hours. Attendance reports also give you the ability to view which shifts are assigned to whom at your company, and how much time they added manually.
Activity Level
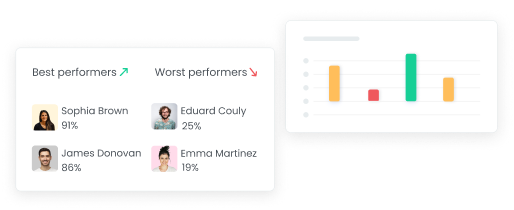
Ensure high productivity with activity level reports. With WebWork’s advanced reporting, you’re able to distinguish between active and idle time easily. These real-time reports show the activity level of your team members while tracking time for each of their assigned projects.
Activity Descriptions
View the activity descriptions of workspace members. With these reports, you can get a detailed view of what your employees were working on with hand-written descriptions. See activities in specific projects, and view those added by specific members.
Charts for Each Report
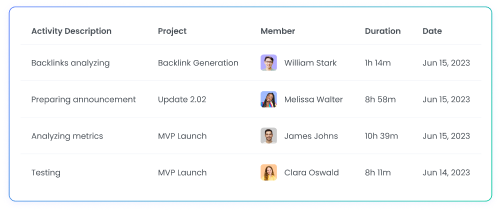
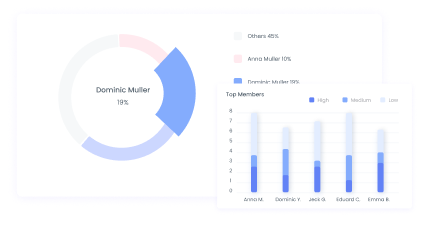
You get detailed charts for each report that visualize the tracked data. Select between line, bar, and pie charts to view long or short-term trends such as a member’s productivity or activity breakdowns. Feel free to customize each chart to your preferences such as the type, the color scheme, and what data it should show.
App and Web Usage
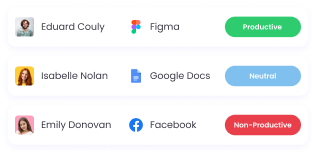
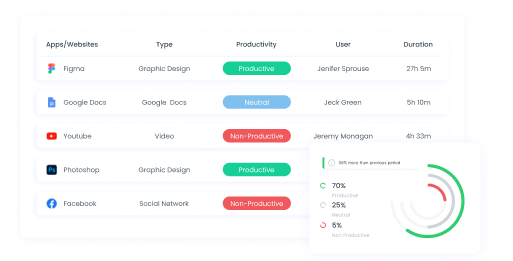
View which apps and websites are used the most in your business. Accurate reporting of site and app usage can help you detect distractions and track working time correctly. Use the advanced reporting view to get insights into your company’s mouse, scroll wheel, and keyboard usage in specific apps.
Employee Geolocation
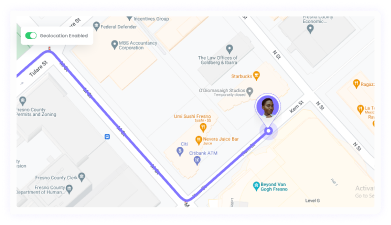
Monitor the location of on-site and remote workers. Ensure your team’s punctuality and that they work in distraction-free environments. View employee geolocation data on a map.
Tasks
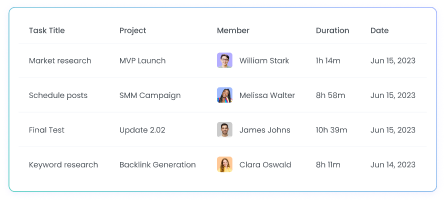
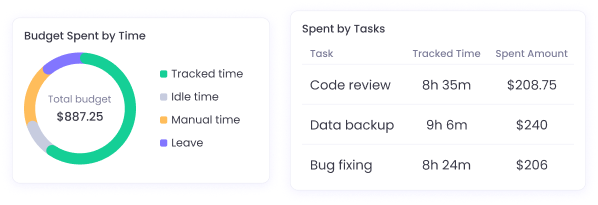
The time reporting software can show you how many hours were spent on each task. See when an employee worked on a task and how much time they spent on it. You’re also able to see which subtasks your team members worked on. Tasks reports allow filtering workspace data by individual members, teams, and projects. Additionally, you can see the earned amounts for each task with many filters.
Billable Hours
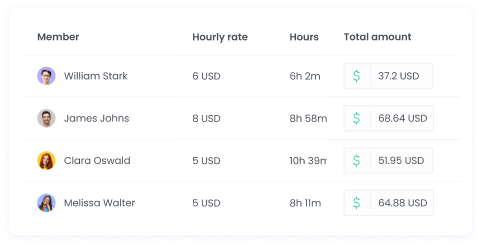
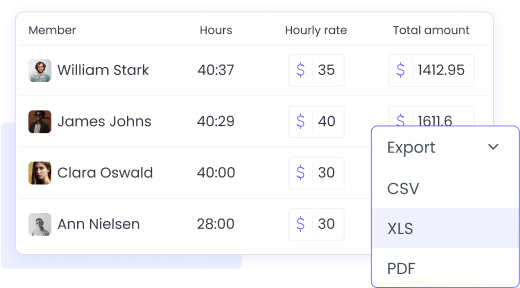
See the earned amounts of each workspace member based on their tracked hours in the Billable Hours report. The report gives you the full picture with data such as hourly rate, tracked hours, amount, payment methods, tracking method, and so on, along with a chart view. You can export the report in the CSV format for your preferred payment method.
Screenshots
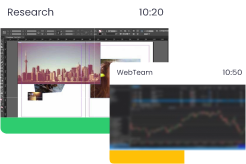
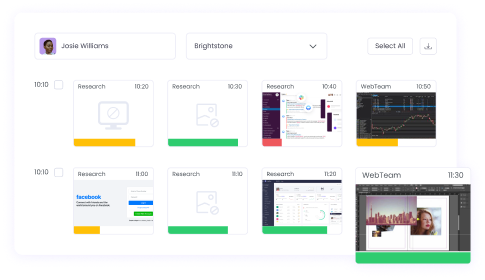
Verify the productivity data of your business with periodic screenshots. WebWork’s screenshots are stored along with the time they were taken at. This will enable you to track how your employees spend their time during work hours. Use this data to identify distractions and help your company stay focused.
Project Budgeting
View how much was spent on each project in a detailed report. Switch between views to see the general report for all projects, or the details of each project separately. This report helps you ensure your projects don’t go over budget or when they do, you can observe them. To get a visual representation of how budgets are spent, use the Chart view.
Payroll
See all payments made directly in WebWork in the payroll report. It shows you all the payments you send to members through PayPal, card, Remote, Bitwage, or Xero. Switch between table and chart views to see transaction details the way you prefer.

Break Report
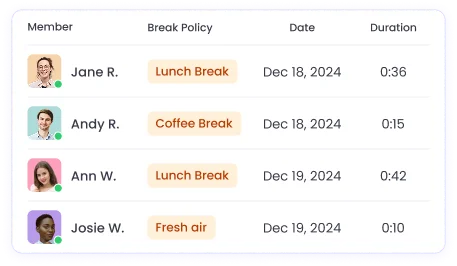
See how much break each workspace member has taken. The report shows you each break log with the Break Policy, date, duration, whether it’s paid or unpaid, and amount if it is paid. To get a visual understanding of the report, switch to the Chart view.

Powerful Insights with Charts
View the reports in pie, bar, or line charts to get instant visual insights into your team's performance. The charts allow you to easily visualize key data such as total work hours, productivity levels, attendance patterns, and app usage.
Choose line charts when you need to track performance trends over weeks or months, revealing patterns in productivity and helping you spot seasonal variations. Switch to bar charts for direct comparisons between team members, departments, or projects, making it easy to identify top performers and areas needing attention. Use pie charts to get quick breakdowns of how time is distributed across different activities or applications throughout the day.
Scheduling Reports
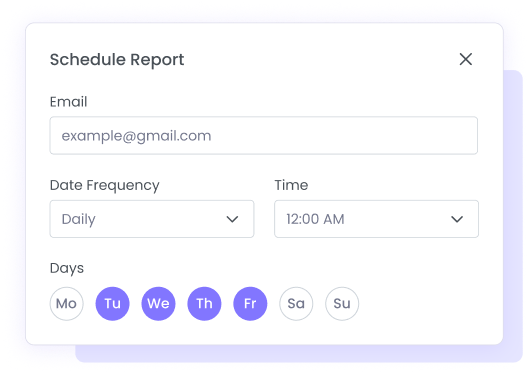
Schedule real-time reports to receive them periodically in your email. Use these reports to track progress over the long term. Choose to receive the data that’s the most important for your workspace.
Export Reports Easily
You may export all of WebWork’s employee time reporting data easily. Choose one of the available formats, such as CSV, XLS, and PDF. Share this data with your clients, or process it with spreadsheet software.
Branded Reports
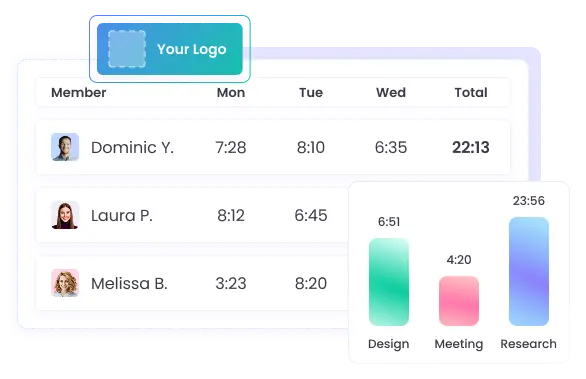
Customize each report by uploading your logo to it to export professional, branded reports. Enhance your company's presentation and ensure consistency across all communications with clients and stakeholders.
FAQ
What is employee time reporting and how does it benefit businesses?
Employee time reporting is the process of collecting and analyzing data about how employees spend their work hours. It includes metrics like tracked time, attendance, productivity levels, task breakdowns, and more. For businesses, time reporting enhances visibility, supports payroll accuracy, improves team accountability, and helps optimize overall performance through data-driven decisions.
How does WebWork Time Tracker generate real-time employee reports?
WebWork uses its desktop time tracker to collect data in real time as employees work. It records tracked hours, activity levels, productivity scores, app and website usage, and more. This data is then visualized in real-time reports on the WebWork dashboard, allowing managers to instantly see who is working, their level of activity, and what projects they’re engaged in.
What data is included in WebWork’s reports?
WebWork’s reports include a comprehensive range of data points such as total hours worked, attendance logs, idle time, manual time entries, activity level percentages, productivity scores, app and website usage, task breakdowns, financial summaries, and more.
Can managers track attendance and productivity levels through WebWork reports?
Yes. WebWork offers dedicated attendance, activity level, and productivity reports. Managers can see when employees start and stop working, whether they arrived late or left early, and how active they were during tracked hours. These reports help monitor punctuality and ensure consistent productivity across the team.
How can time reporting improve team performance and accountability?
Time reporting provides visibility into how time is used across tasks and projects. It allows managers to identify high-performing employees, uncover inefficiencies, and allocate resources more effectively. When employees know their work is being tracked, it fosters a culture of accountability and focus, leading to improved performance and collaboration.
Is WebWork’s employee time reporting compliant with labor and data protection laws?
Yes. WebWork is designed to support compliance with labor and data protection regulations. It tracks time only during active work hours and allows companies to configure privacy settings. All data is securely stored and access is limited to authorized roles like Workspace Owners and Managers. Organizations should also communicate their time tracking policies to team members transparently.
Can I export employee time reports for clients or payroll?
Yes. WebWork lets you schedule automated reports to be delivered via email at regular intervals. You can also export reports in CSV, XLS, or PDF formats and share them with clients. Reports can be customized and branded with your company logo for professional use.
How accurate are the productivity scores and activity level metrics in WebWork reports?
WebWork calculates productivity and activity scores based on real-time input from keyboard and mouse usage. The system categorizes apps and websites as productive, neutral, or non-productive, and provides precise scores that reflect engagement during tracked time. While highly accurate, scores should be viewed in context with the type of work being done.
What formats can I use to export time reports in WebWork?
WebWork supports CSV, XLS, and PDF export formats for the reports. These formats ensure compatibility with payroll systems, spreadsheet tools, and client invoicing software. You can export the finance report in the CSV formats for Payoneer WFM, PayPal, Wise, and Gusto.
